Metso Insights Blog Mining and metals blog Benefits of advanced simulation for mining operations
Mining
Aug 15, 2019

Benefits of advanced simulation for mining operations

All geological material is heterogeneous. Understanding the variability of run-of-mine material provides a base for efficient mining and minerals processing operations. The development of geometallurgy, including mineralogy and processing performance, is the key for the optimizing operations. Advanced simulation can be used to predict and compare various operational scenarios and their performance, including metallurgical recovery, consumption of water, energy and chemicals, environmental footprint and economic value.
HSC Chemistry
Figure 1. HSC Chemistry – A leading simulation software

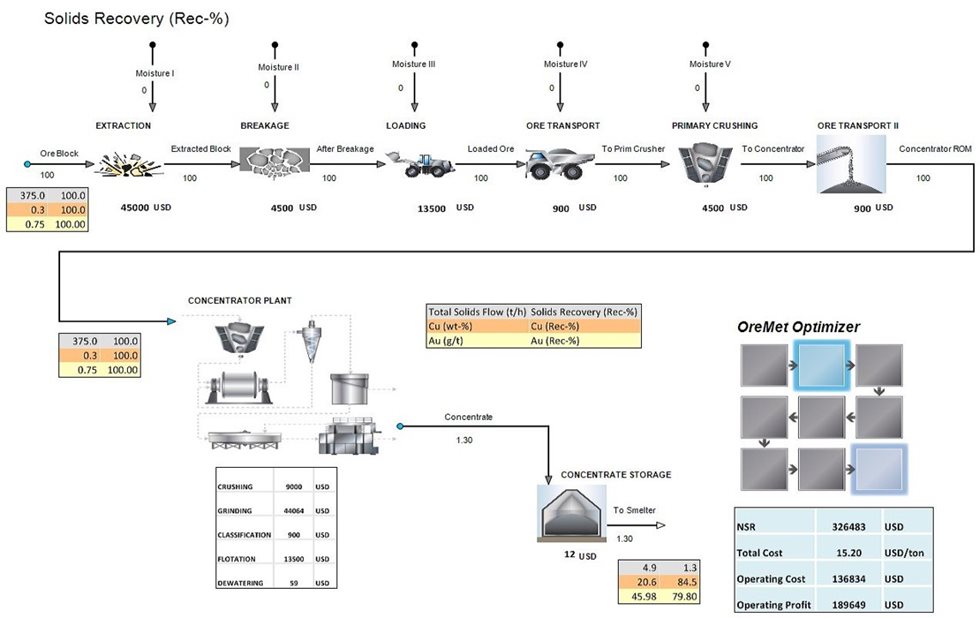
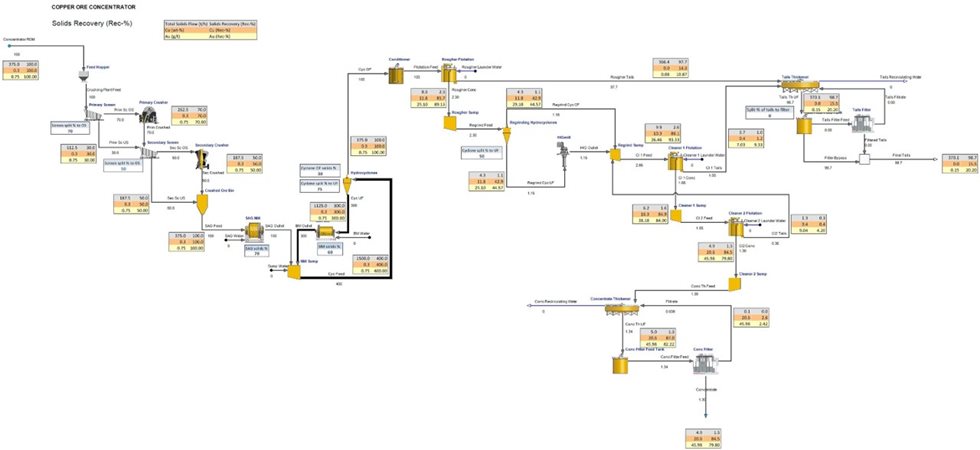
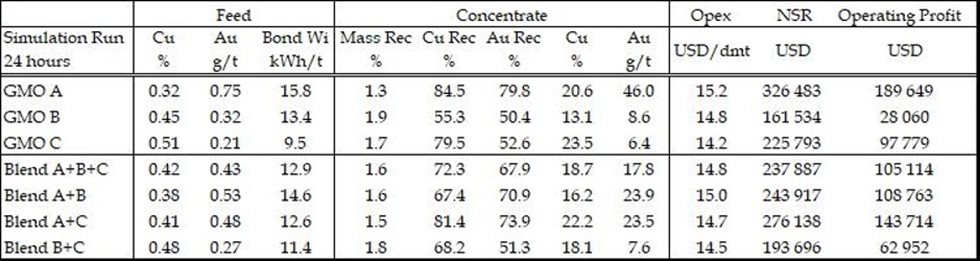
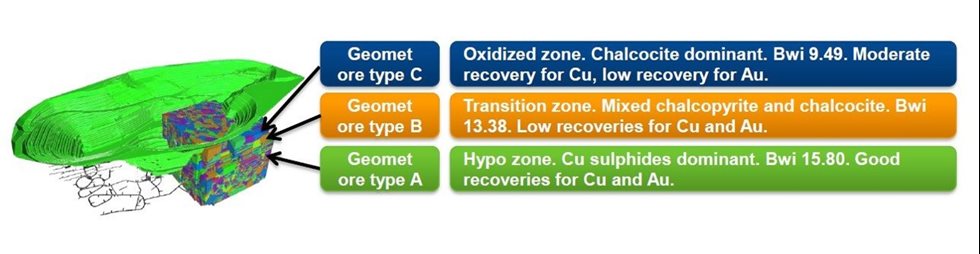
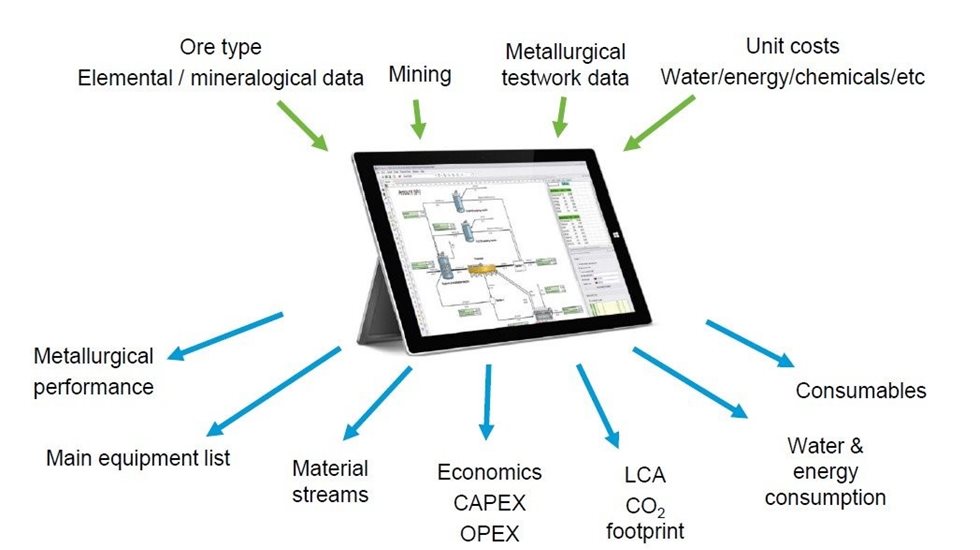
The co-operation with RMG started with process audits and mineralogical and chemical characterization of process samples. This was followed by detailed chemical and mineralogical characterization of six different ore types with simultaneous flotation test work. Based on the results, a preliminary geometallurgical classification of ore types was developed. The whole value chain was then modelled in Outotec HSC Chemistry 9 software to optimize the process design and improve the efficiency and value of production.

Geology at Madneuli and Sakdrisi

According to a technical report by RMG (2016), the copper–gold mineralized domains at Madneuli and Sakdrisi are hosted by an upper Cretaceous sequence of volcano-sedimentary rocks.

The Madneuli deposit is characterized by a north–east trending dome, with the limbs of the dome dipping at between 10 to 40°. Several steeply dipping faults occur throughout the deposit. The layers of rock are mainly composed of rhyodacitic pyroclastic rocks, with the core of the dome comprising coarse-grained and medium-grained tuffs. These rocks are overlain by a package of alternating tuffs and tuffaceous sandstones. Hydrothermal alteration of the pyroclastic host rocks of the Madneuli deposit includes silicification, chloritisation, sericitisation and sulphidisation. The altered zones are typically irregularly shaped, and the degree of alteration is strongest in the core of the dome, decreasing towards the marginal zones.

The Madneuli deposit displays three mineralization styles: vein-disseminated, breccia and massive stockwork mineralization. Most of the copper–gold mineralization is confined to areas of silica-rich alteration.

Typical mineral textures of the deposits
Figure 2. Typical mineral textures of the deposits.

Mineralization within the Sakdrisi deposit is controlled by structure and lithology comprising predominantly pod-like bodies, sheeted vein-sets and low-grade stockwork. The primary mineralization has been overprinted by surface weathering processes, resulting in zones of sporadic supergene enrichment. Gold generally occurs as free grains, on sulphide boundaries and with silica grains to a minor degree. The mineralization style is considered to represent a transitional type between VMS and epithermal gold type.

Samples and analytical methods

The ore samples from Madneuli and Sakdrisi were divided into subsamples: one subsample was used in chemical analysis and mineralogical studies, and one subsample was used for flotation test work. The chemical and mineralogical characterization tests were carried out at the laboratories of Outotec Research Centre in Finland and the locked cycle flotation tests were performed at RMG’s Madneuli laboratory in Georgia.

The detailed chemical assays include complete assays after total dissolution by inductively coupled plasma–optical emission spectrometry (ICP–OES), gold and silver assays by fire assay and sulfur and carbon contents were analyzed by combustion. In addition, the copper content was analyzed after a four-stage sequential copper phase assays procedure, described by Young (1974) and further developed by Outotec. This procedure enables the chemical quantification of different copper sulfates, oxides, secondary copper sulfides and primary copper sulfides by using the element to mineral conversion (EMC) method available in the HSC Chemistry 9 Geo module (Lamberg et al., 1997; Lund et al., 2013). The main minerals and their mode of occurrence were first studied by optical microscopy and X-ray diffraction. Scanning electron microscopy and liberation measurements were performed using a field-emission scanning electron microscope equipped with an energy-dispersive spectrometer (EDS) coupled with INCAMineral liberation measurement software (Liipo et al., 2012). The hardness of each ore type was determined according to the standard Bond grindability test (Bond, 1961).

Mineralogical study
Figure 3. Mineralogical study at the Outotec Research Center in Finland.

Ore types and geometallurgical classification

The results of mineralogical characterization and the locked cycle flotation tests data were reprocessed with the HSC Chemistry 9 Data module utilizing linear regression analysis and principal component analysis. This analysis of combined data revealed the occurrence of two geometallurgical endmember ore types based on mineral composition and grindability;

  • Chalcopyrite–dominant
  • Chalcocite–dominant

The rest of the samples lie within these endmember types. The chalcopyrite-dominant ore type represents less altered primary zones, and, with increasing alteration, the amount of chalcocite and secondary copper oxides increases. The highest concentrate grades and recoveries for both copper and gold were achieved from the chalcopyrite-dominant ore type and with increasing alteration both grades and recoveries deteriorate. The main characteristics of the three geometallurgical ore types (GMO A, B, C) and their test work results are presented in Table I.

Geometallurgical ore types (GMO) and main characteristics
Table I. Geometallurgical ore types (GMO) and main characteristics.

Simulation software and parameters

The simulations are based on the mineralogical and flotation test work data from the Madneuli and Sakdrisi ore samples and a conceptual copper concentrator plant design. The parameters (e.g., operating costs, treatment and refining charges, etc.) used in the OreMet Optimizer simulation included in the HSC Chemistry 9 Sim are of general nature and do not represent any specific operations (Table II).

arameters used in OreMet Optimizer simulation
Table II. Parameters used in OreMet Optimizer simulation.

The processing of different ore types was assessed in terms of each ore’s metallurgical response and economic revenue when mined and processed in a concentrator plant. The evaluation was carried out with the HSC Chemistry 9 Sim module. Cost factors for each step – starting from ore block extraction continuing through all the mining and concentrator plant processing phases – were evaluated separately. The resulting concentrate value was calculated by means of the Net Smelter Return (NSR) formula. The economic revenue evaluation tool, OreMet Optimizer module, is available and integrated with the HSC Sim minerals processing flowsheet simulator. The simulator flowsheet is shown in Figure 2, and Figure 3 expands the detail of the concentrator plant model. The conceptual concentrator plant design consists of a two-stage crushing section, semi-autogenous (SAG) and ball mill grinding, rougher Cu–Au bulk flotation with subsequent re-grinding, two-stage cleaner flotation and dewatering.

Ore block mining and processing flowsheet
Figure 4. Ore block mining and processing flowsheet with integrated OreMet Optimizer economic assessment.

The advantage of the HSC Sim flowsheet simulation with integrated OreMet Optimizer economic assessment tool is that the throughput and composition of each processing step is obtained directly according to the simulated ore metallurgical response. Operating expenses (OPEX) per throughput USD/ton of each processing stage are given or determined according to ore processing characteristics. The value of the final concentrate is calculated using the Net Smelter Return (NSR): NSR = ∑ Product values - ∑ Penalty costs - ∑ Treatment charge - ∑ Refining charge.

Minerals processing concentrator plant with Cu–Au flotation
Figure 5. Minerals processing concentrator plant with Cu–Au flotation.

The economic revenue for given size of ore block (or blended ore) with predefined run of mine (ROM) feed rate is calculated by subtracting the total costs from the NSR, giving the operating profit/loss for that running time period of the production.

Simulation results

The simulation runs included separate simulations for each geometallurgical ore type (GMO A, B, C) and for various blends [Blend A(1/3)+B(1/3)+C(1/3), Blend A(½)+B(½), Blend A(½)+C(½), Blend B(½)+C(½)]. The simulation run represents 24 h operation, totaling mining and treatment of 9000 tons of ore. The simulation results clearly demonstrate that the variability in the mill feed has significant impact on the processing performance and economics of the operations. The simulation results are summarized in Table III.

Summary table of simulation results
Table III. Summary table of simulation results.

The operational costs for different ore types vary between 14.2 and 15.2 USD/t, mainly reflecting the variations in the Bond Work Index and energy consumption in grinding. The flotation test work showed significant variations in the recoveries and concentrate grades between ore types. As a result, there are significant differences in the NSR values and operating profit for various geometallurgical ore types and blends.

The chalcopyrite-dominant ore type GMO A yields by far the highest NSR and operating profit, despite having the highest operating costs. The chalcocite-dominant ore type GMO C produces the second-highest NSR and operating profit, and the chalcopyrite–chalcocite mixed ore type GMO B provides the lowest NSR and operating profit.

 Ore types at the RMG site in South Georgia
Figure 6. Ore types at the RMG site in South Georgia.

The in-situ values of copper (@USD 6000/t) and gold (@USD 1300/t) contents are:

  • ~USD 50/t for GMO A
  • ~USD 40/t for GMO B
  • ~USD 39/t for GMO C

The differences in the NSR values between the geometallurgical ore types are far larger than the differences in the metal grades and in-situ values. This highlights the importance of the understanding of the mineralogy and processing performance as the key value drivers. In practice, it is not typical that various ore types are mined and processed separately. The simulated blending scenarios provide additional information for production planning.

Summary

Identifying the variability within an ore deposit and understanding the mineralogical composition and the metallurgical performance of the various ore types are key factors for efficient mining and minerals processing. The simulation of the whole value chain from extraction to payable product provides useful information on the value drivers of the deposit and operations. The example case demonstrates that the variability of the ore types, particularly on the mineralogical composition and processing performance, plays a key role in the value generation by the operations.

Project or production planning that does not take into account mineralogical composition and metallurgical performance leads to non-optimized operations. For example, the cut-off grades for the Ore Reserve estimation should consider not only the metal grades, but the mineral grades and the respective variability of the metallurgical performance.

Acknowledgements

This article is based on a conference paper presented at SAIMM Copper Cobalt Africa - 9th Base Metals Conference held in Livingstone, Zambia, July 9-12, 2018. The authors of the paper are listed below.

Matti Talikka 1), Antti Remes 1), Matthew Hicks 1), Jussi Liipo 1), Vesa-Pekka Takalo 1), Sandro Khizanishvili 2), and Malkhaz Natsvlishvili 2)

1) Outotec, Espoo, Finland
2) JSC RMG Copper, Tbilisi, Georgia

References

Bond, F.C. (1961). Crushing and grinding calculations. British Chemical Engineering, 6 (6), 378–385.

Hunt, J., Berry, R., Bradshaw, D. (2011). Characterising chalcopyrite liberation and flotation potential: Examples from an IOCG deposit, Minerals Engineering, 24, 1271–1276.

Lamberg, P., Hautala, P., Sotka, P., Saavalainen, S. (1997). Mineralogical balances by dissolution methodology. Proceedings Short Course on ‘Crystal Growth in Earth Sciences.  Mamede de Infesta. S. (ed.), Portugal. pp. 1–29.

Liipo, J., Lang, C., Burgess, S., Otterström, H., Person, H., Lamberg, P. (2012). Automated mineral liberation analysis using INCAMineral. Proceedings Process Mineralogy ‘12, Cape Town. pp. 1–7.

Lund, C., Lamberg, P., Lindberg, T. (2013). Practical way to quantify minerals from chemical assays at Malmberget iron ore operations - an important tool for the geometallurgical program. Minerals Engineering. 49, 7–16.

Rahfeld, A., Kleeberg, R. Möckel, R., Gutzmer, J. (2018). Quantitative mineralogical analysis of European Kupferschiefer ore.  Minerals Engineering, 115, 21–32.

JSC RMG (2016). Technical Report on the JSC RMG Copper Mine Operations: Madneuli & Sakdrisi in Georgia (unpublished).

Young, R.S. (1974). Chemical Phase Analysis. Charles Griffin and Company Limited.

Mining