Periodic Chart Module
The basic chemical and physical properties of the elements have a decisive effect on the thermochemical properties of compounds.
HSC Ele – Periodic Chart Module
Periodic Chart Module

Supporting your operations, from plant design expertise to equipment, parts and services for every stage of your process.
Are you looking to increase production, reduce risks, lower operating costs and enhance environmental performance? Then you are in the right place.
From the design and supply of products for a greenfield plant, to the addition of a single machine for an existing production line, we are here to help.
Rely on OEM experts because not all parts are created equal. Spare and wear parts built to perform.
Helping you get the most out of your equipment and processes.
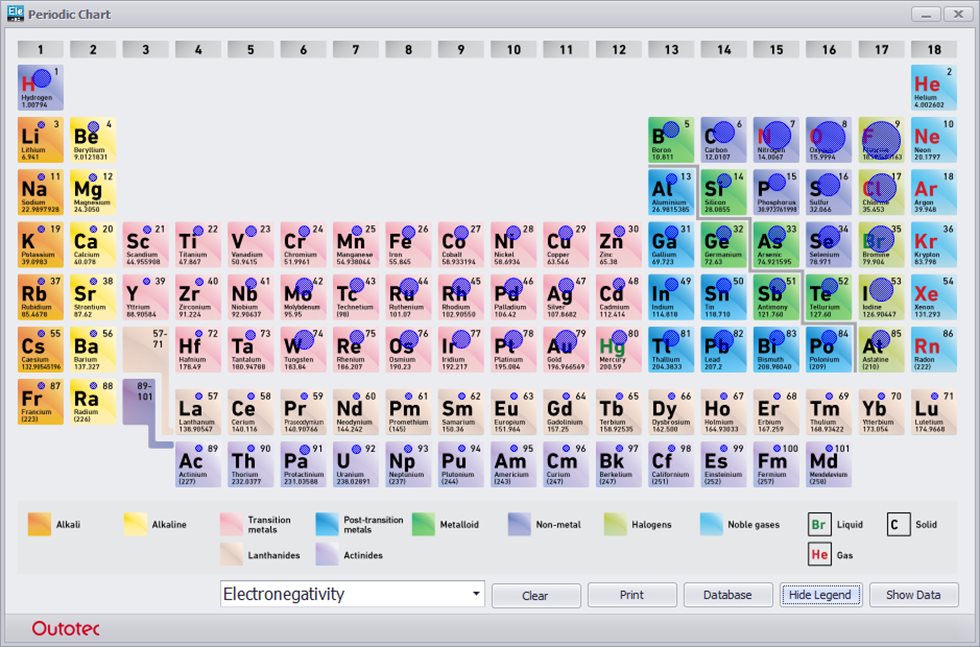
For example, the electronegativity values of the elements have a strong effect on the chemical bonds between the elements in all chemical compounds. Therefore the periodic system of elements provides the base for thermochemistry.
Different properties can be plotted on the chart by selecting a property from the menu below the chart. The chart shows at a glance the greatest and smallest values in the periodic system. The exact number values behind the spheres can be shown by clicking the element square or label in the diagram. The diameter of the sphere shows the magnitude of the value compared to the maximum value.
The periodic chart module offers an element database in spreadsheet format with some 56 different element properties. Users can easily add their own data to this table in the same way as in MS Excel applications. This data may be saved for later use by selecting File Save.