Metso Insights Blog Mining and metals blog Simulation of flotation plants
Mining
Jun 16, 2017

Utilizing plant simulation to design and optimize flotation processes

Simulation models for concentrator plants are ’must have’ tools for designing greenfield plants, and are also used to optimize and benchmark performance of brownfield operations. Practical simulation engineering tools are based on experimental data obtained from laboratory tests and from plant sample and operations data.
Outotec GTK LabCellTM for laboratory flotation tests
Figure 1: Outotec GTK LabCellTM for laboratory flotation tests; the machine has adjustable air feed and rotor rotation speed, and automatic froth scraping mechanism

KINETIC FLOTATION MODEL: BASED ON TEST WORK

In the kinetic flotation model, mineral recoveries are calculated based on the flotation cell residence times and the particle flotation rate constants. For example, Outotec HSC Chemistry® Sim flowsheet simulation software utilizes a unique property based modeling approach, which means that the solids feed material is based on minerals that are always defined as particles, and have properties such as size fraction, solids density, floatability, etc. Thus, the material is set up similarly to real slurry streams and the chemical composition is calculated based on its particles and mineral composition.

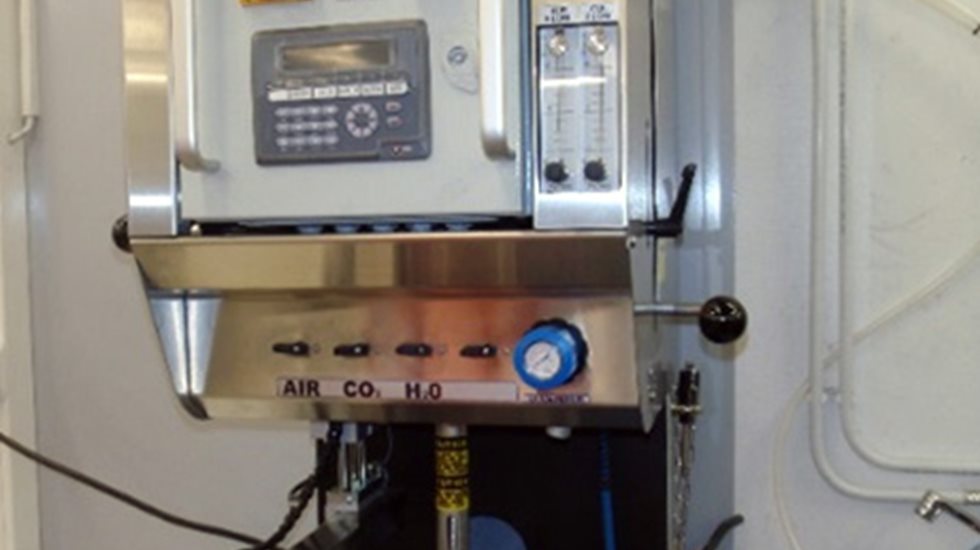
The flotation kinetic model parameters are derived from continuous plant sampling data or from batch laboratory tests. Figure 1 shows the Outotec GTK LabCell laboratory flotation machine for batch testing.

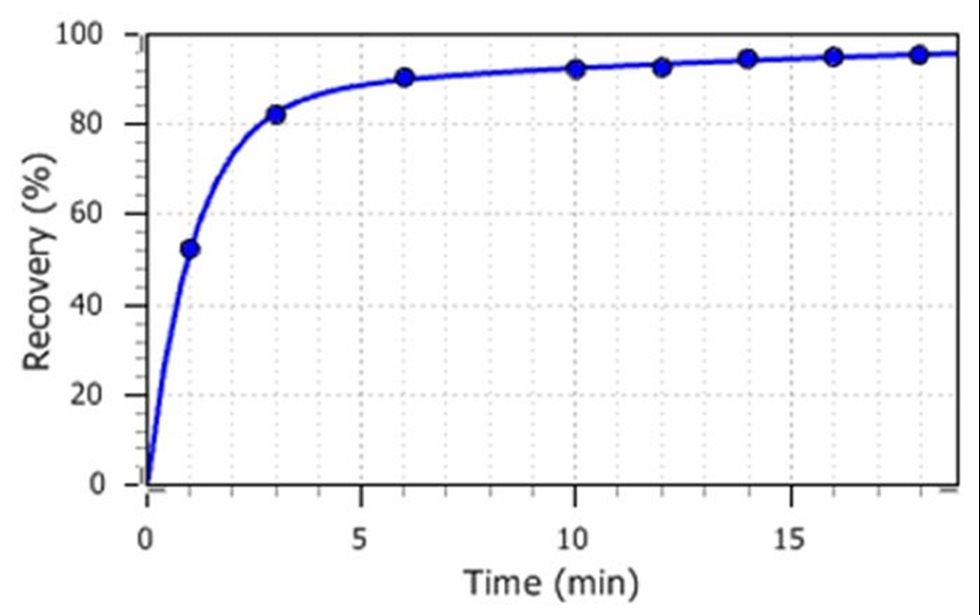
The outcome of a kinetic batch flotation test is a series of cumulative recoveries of assayed elements as a function of time. The element recoveries are further converted to mineral recoveries. The benefit of the conversion is that the gangue kinetics can be calculated and the total mass recovery is obtained from the mineral recoveries. The cumulative kinetic data is model fitted to set up equations based on the flotation kinetic rate constants k min-1. Both the element-to-mineral conversion and the kinetics model fitting tools are included in the HSC Chemistry® software.

Batch flotation kinetic test results
Figure 2: Batch flotation kinetic test results of the Buenavista del Cobre plant II rougher bank feed sampe - cumulative recovery of chalcopyrite (dots) with model fitted kinetic recovery equation (line).

FLOTATION MODEL SCALE UP AND OUTCOMES

When the continuous plant simulation model is based on the batch model fitted kinetic recovery equations, it often requires scaling up. The HSC Sim simulator calculates the cell residence times automatically based on the simulated volumetric flow rates and given cell dimensions. In a flotation plant flowsheet simulator, each cell is operated with continuous recovery models using the same batch test based kinetic mineral parameters, but adjusted with a scale up factor. The scale up factor is a ratio of the required plant time compared to the laboratory time to achieve the same target recovery. In addition, the simulation model can take into account froth recovery as well as various cell operating parameters like froth depth, air feed rate, air hold up and air bubble size.

Figure 3 shows plant sampling results of the Buenavista del Cobre plant II rougher line’s copper grade and recovery together with HSC Sim simulation model predictions. The model was based on the laboratory batch tests (Fig. 2), calibrated with a scale up factor and cell-by-cell froth recovery parameters. This way the existing flotation plant can be simulated with a very high accuracy (Fig. 3). If only the scale up factor was used in the simulation (without froth recovery parameterization), and a ±20% error for the scaling up was introduced, the resulting relative errors in the cumulative rougher concentrate recovery would be 2 rel.-% (1.9 percentage points) and in the grade less than 7 rel.-% (1.1 percentage points). Thus, also with this set up, the simulation showed good and robust results.

Cu grade and recovery measurement and simulations
Figure 3: Buenavista del Conre plant II rougher line cumulative Cu grade and recovery measurement and simulations

For a greenfield plant design, the flotation models are typically based on kinetic laboratory tests carried out both for the rougher and cleaner stages. It is also common to carry out closed loop locked cycle laboratory tests and pilot plant test runs to model-fit and calibrate the plant design simulation model. In addition to equipment sizing, it is possible to study the grade-recovery response with different feed compositions and capacities, and with various cell operating parameters. As well as evaluate and design different flowsheet configurations.

SUMMARY

The flotation plant flowsheet simulation models provide an efficient way to assess existing circuit operation, further optimize its operating conditions and to evaluate different circuit reconfigurations. When planning a new flotation plant design, simulation models can be used to design the circuit configuration and cell sizing. In both cases the models are based on experimental data from the minerals flotation kinetics. The Outotec HSC Chemistry® 9 Sim module includes high-end tools for fitting the recovery models for the data and simulating full scale flotation plants.

Mining