Metso Insights Blog Mining and metals blog Improved mill control at Lihir Gold Mine in Papua New Guinea
Mining Metals refining
Oct 25, 2018

Improved mill control at Lihir Gold Mine in Papua New Guinea

At the Lihir Gold Mine, the concentrator plant was utilizing SAG mill’s bearing pressure to calculate load measurement for their mill. Following a series of SAG mill overload events that caused significant milling downtime, the mill operators and metallurgists lost confidence in the repeatability and accuracy of the load measurements. There was a clear need for a better method of measuring and controlling the volumetric filling.
The Lihir open pit mine
Figure 1. The Lihir open pit mine is located on Niolam Island, Papua New Guinea.

The Lihir Gold Mine is operated by Lihir Gold Limited, a subsidiary of Newcrest Mining Limited. The open pit mine is located on Niolam Island, Papua New Guinea, approximately 900 kilometers north-east of Port Moresby. In 2017, the Lihir Gold Mine produced 940,060 oz of gold and milled 13.001 Mt at an operating rate of 1,797 tph. (Newcrest Mining Limited, 2017a).

The plant’s comminution circuit currently consists of two primary crushing and overland conveyors circuits; and two SABC (HGO1 & HGO2), and one SAB (FGO) grinding circuits, as seen in a simplified process flow diagram in Figure 2.

Simplified Lihir Process Flow Diagram
Figure 2. Simplified Lihir Process Flow Diagram - Mass flows listed for September 2017 Quarter (Newcrest Mining Limited, 2017b).

Measuring SAG mill volumetric filling at Lihir

Controlling the volumetric filling in the mill is necessary to optimize the mill’s throughput rate. Traditionally, volumetric filling has been inferred by controlling to a total mill weight either from bearing pressure or load cells. However, the mill weight is destabilized by two factors, decreasing liner mass and changing charge density.

At the Lihir Gold Mine, the plant was utilizing mill’s bearing pressure to calculate load measurement for the SAG mill in HGO1. The use of SAG mill weight for process control is additionally complicated at Lihir by compromised and suddenly drifting load cell and bearing pressure measurements on two of the process plant’s three SAG mills. This drifting behavior means that an optimized mill-load setpoint that delivered maximum throughput at the start of a shift, is likely not the optimal mill load-setpoint later in that shift even though the same ore is being fed throughout. Following a series of SAG mill overload events (example Figure 3) that caused significant milling downtime, the mill operators and metallurgists lost confidence in the repeatability and accuracy of the load measurements. There was a clear need for a better method of measuring and controlling the volumetric filling.

{{zoomedImageIndex + 1}}/2
{{ captions[zoomedImageIndex] }}

Background to optimal volumetric filling

Experienced SAG mill operators are familiar with the concept that an optimal volumetric mill filling exists, which maximizes the mill throughput rate of a set feed material. The grind curve work of Powell and Mainza (2006) and Powell et al (2009) demonstrated that the optimal volumetric mill filling for maximum federate does not necessarily align with maximum power draw, especially for high aspect SAG mills. It follows that SAG mill process control systems that target maximum SAG motor power will not necessarily result in the maximum milling rate. Instead, SAG mill process control systems that aim to maximize SAG mill federate should target operation at the optimal volumetric mill filling for the prevailing feed.

Despite the importance of volumetric mill filling, a measurement is not traditionally provided to the mill operator or metallurgist by instrumentation (Toor, 2015). However, an inferred measurement can be made using a SAG mill weight measurement, using either bearing pressure transducers or load cells. Details of various SAG process control systems have been published extensively in literature (Karageorgos, 2006; Baas, 2014; Ruel, 2013; Smith et al, 2004). A common approach across these systems is to provide the mill operator with a SAG weight setpoint. Mill feedrate and mill speed for mills equipped with variable speed drives are manipulated by the control system to control mill weight to this setpoint. As mill feed competency and feed size changes, the optimal volumetric mill filling for maximum feedrate changes. The weight setpoint is adjusted by either an experienced operator or an advanced process control system in response to the feed changes.

The SAG mill weight measurement combines mill shell mass, charge mass and liner mass. Powell (2006; 2009), via a series of mill charge inspections at various operating mill weights, confirmed that strong relationships can be developed between volumetric mill filling and mill weight. These relationships will only hold in the short term if ball charge is constant with time (changing charge density) and will not hold over the longer term due to wearing of mill liners (wearing liner mass) (Toor, 2015). Consequently to maintain volumetric filling within a set operating range, continual review of the weight setpoint is required due to changes in SAG mill charge density (rock:ball ratio) and the wearing of mill liners. As examples, Figure 5 presents the characteristic reduction of SAG mill weight setpoint across the mill shell liners lives of the Telfer Gold Mine Train 2 SAG mill and the Lihir Gold Mine FGO SAG mill.

Reduction of SAG mill weight SP across shell liner life
Figure 5. Reduction of SAG mill weight SP across shell liner life (a) Telfer Train 2 (b) Lihir FGO.

Towards new measurement method at Lihir

The Lihir Process Plant explored new instrumentation options, such as the measurement charge toe, culminating with the installation of the Outotec MillSense in late 2016 on the HGO1 SAG mill. The Morrell power model specifies a relationship between toe angle and mill filling (Napier Munn et al, 1999), presented in Figure 6 for the Lihir Process Plant’s identical HGO1 and HGO2 SAG mills.

 Toe angle - mill filling relationship for HGO1 and HGO2 SAG Mills
Figure 6. Toe angle - mill filling relationship for HGO1 and HGO2 SAG Mills.

To address the need for a more reliable state indicator with robust control, Outotec has developed the MillSense system for analyzing and controlling a grinding mill’s volumetric charge. MillSense works by identifying the position of the charge inside the mill, which is accomplished by continuously measuring the vibration and strain of a liner bolt. The complete MillSense system consists of an on-bolt sensor unit, an on-shell transmitter, a radio receiver, a connection cabinet, an inductive charging station and an analysis computer. Figure 7 shows the equipment and their locations on the shell and near the mill.

MillSense field equipment
Figure 7. MillSense field equipment.

MillSense can detect the mill toe angle either from the revolution’s bolt strain or bolt vibration profile. When considering the strain profile, the toe can be identified by finding the point where the signal changes most rapidly. When the vibration signal is used, the toe can be found at or near the maximum. Figure 8 illustrates the vibration and strain profiles for a single mill revolution. The vertical lines mark the locations of the detected toe (first half of the graph) and shoulder (second half of the graph) angles for both signals. In steel-lined mills, the vibration signal usually produces a more consistent toe angle measurement, while the strain signal tends to be extremely clear in rubber-lined mills.

Strain and vibration profiles of a single mill revolution
Figure 8. Strain and vibration profiles of a single mill revolution.

Once the toe angle is known, the mill charge is calculated using the Julius Kruttschnitt model (Napier- Munn et al., 1999) for the charge shape. The volumetric charge cannot be directly solved from the equations, but a moderate number of iteration steps or a lookup table yield good results in practical applications. While the shoulder angle of the charge is not strictly needed for the calculation of volumetric charge, it can still provide valuable insight on the mill’s dynamics to the operators and metallurgists. The shoulder angle can be detected most reliably from the strain profile.

Commissioning and assessment of the new system

The MillSense toe angle control was implemented in March 2018. It was commissioned approximately 2 weeks prior to a planned mill reline. This allowed the opportunity to assess the performance of the control and signal both on worn and new shell liners. The results showed that the toe angle operating range was consistent both prior to and after the full shell reline. In comparison, the mill weight displayed an increase attributable to the higher mass of a newly installed liner package. The stability in the toe angle highlights the benefit of removing the need to regularly manipulate the mill load setting to account for variable liner mass as discussed previously.

Importantly for Lihir, the toe angle measurement and control demonstrated consistent and repeatable performance during process conditions upsets. Mill operators reported an improvement in ease of operating the control loop over the previous weight control. To assess whether toe angle control improved the consistency of volumetric filling, the distribution of mill power was compared before and after the implementation of the control change. Figure 9 displays histograms of mill power, speed, weight and toe angle for 4-day period before and a 3-day period after the change. The data has been filtered to narrow operating speed range of 9.75 – 10.0 rpm, to reduce the influence of speed on the mill power histogram, and to isolate changes in power draw due to changes in volumetric filling.

Frequency histogram
Figure 9. Frequency histogram comparing the performance of mill weight control (30 Apr – 3 May 18) & toe angle control (9 May – 12 May 2018) over a speed range of 9.75 - 10.0 rpm.

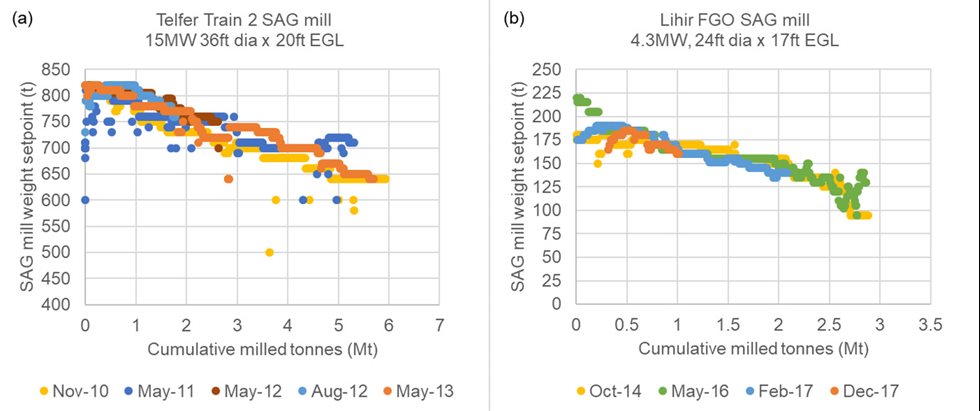
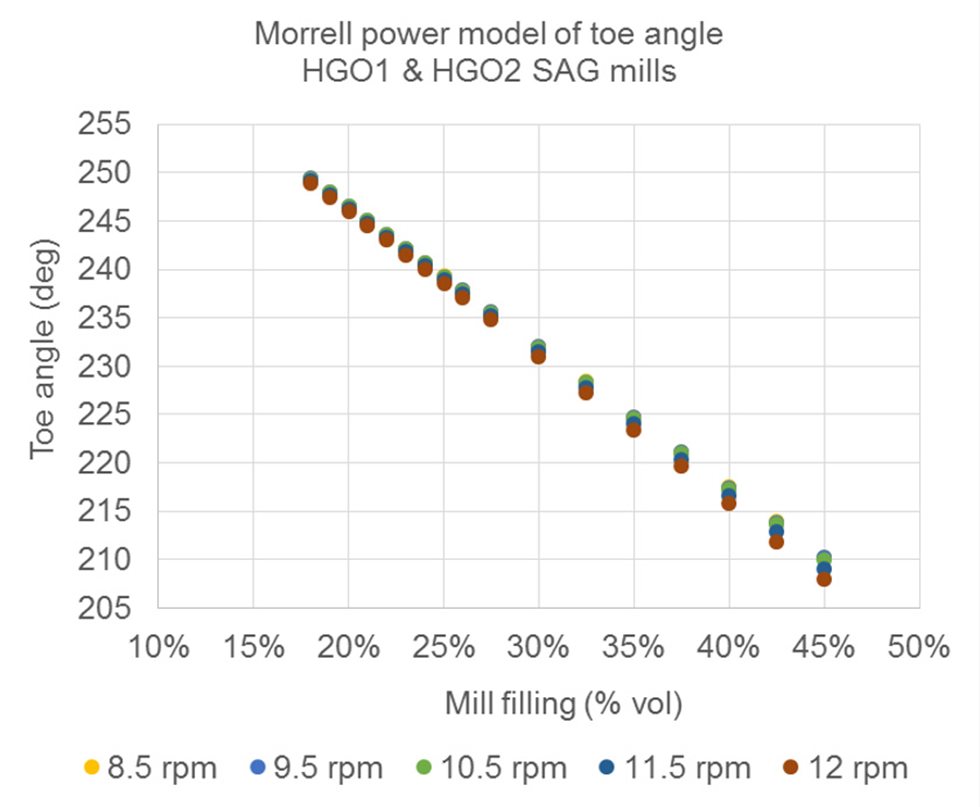
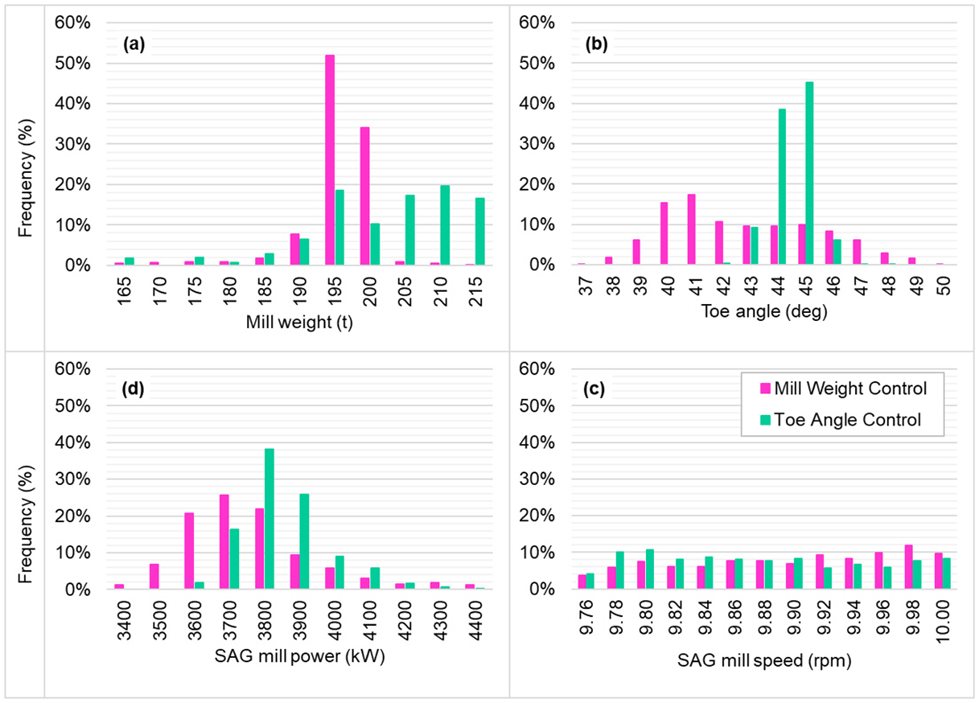
Figures 9(a) and (b) show that both weight and toe angle control strategies achieved a comparable distribution of each controlled variable to its respective set point. Notable is that a narrow weight distribution did not result in a narrow toe angle distribution (and vice versa), highlighting the drifting nature of the weight signal. Further, the power histogram, Figure 9(d), developed during the toe angle control trial presented a more defined, narrower peak than that developed during the weight control period. Given that a reasonably consistent speed distribution (Figure 9(c)) exists between the two compared data sets, it was assessed that a narrower distribution of SAG mill volumetric filling was achieved when the SAG mill was operated toe angle control in comparison to the incumbent weight control.

Conclusions

Initial results indicate that toe angle control has delivered a benefit to Lihir process control by being repeatable measurement, consistent through process interruptions and independent of mill liner wear. Quantifiable production improvements were not available at the time of writing, but improved control of volumetric filling was achieved and reduced the risk of further mill overload events was realized by the implementation of toe angle control on the HGO1 SAG mill.

Acknowledgements

This article is based on the ‘Toe angle measurement for SAG mill control at Lihir gold mine’ paper presented at the AusIMM Mill Operators’ Conference, August 29-31, 2018. The authors of the conference paper are listed below. The contributions of the Lihir metallurgy, operations, instrumentation and process control teams provided valuable feedback and assistance throughout the development and implementation of MillSense. Without their collective contributions the success of this installation would not have been achieved.

F Burns1, C Aisthorpe2, P Blanz3, M Randall4, P Ebzery5

1. Senior Metallurgist – Plant Optimisation, Lihir Gold Mine, Newcrest Mining Limited.
2. MAusIMM, Senior Metallurgist – Plant Optimisation, Lihir Gold Mine, Newcrest Mining Limited
3. Product Manager – Advanced Process Control, Outotec.
4. Senior Metallurgist – Process Control, Lihir Gold Mine, Newcrest Mining Limited
5. Specialist – Process Control, Lihir Gold Mine, Newcrest Mining Limited

References

Baas, D, Bennett, D, Walker, P 2014. Developing process control standards for optimal plant performance at PanAust Limited, 12th AusIMM Mill Operators’ Conference, pp. 325-334.

Karageorgos, J, Genovese, P, Baas, D 2006. Current trends in SAG and AG Mill Operability and Control, SAG 2006.

Ketcham, V J, O’Reilly, J F and Vardill, W D 1993. The Lihir Gold project: Process plant design, Minerals Engineering, 6(8-10)1037.

Napier-Munn, T.J 2009. An Introduction to Comparative Statistics and Experimental Design for Minerals Engineers (2nd Edition), Julius Kruttschnitt Mineral Research Centre, University of Queensland.

Napier-Munn, T.J, Morrell, S, Morrison, R.D, Kojovic, T 1999. Mineral Comminution Circuits: Their Operation and Optimisation, Julius Kruttschnitt Mineral Research Centre, University of Queensland.

Newcrest Mining Limited, 2017a, 2017 Annual Report, 09 October 2017.

Newcrest Mining Limited, 2017b, September 2017 Quarterly Report, 26 October 2017.

Noble, A, Clark, A and Akis, D 2009. Lihir Gold Limited – A Large Step Forward for the Lihir Gold Mine, 10th AusIMM Mill Operators’ Conference, pp 1-6.

Powell, M, Toor, A 2006. Extended grinding curves are essential to the comparison of milling performance, Minerals Engineering Vol. 19, Issue 15, December 2006, pp. 1487-1494.

Powell, M.S, van der Westhuizen, A.P, Mainza, A.N 2009. Applying grindcurves to mill operation and optimisation,
Minerals Engineering Vol. 22, Issue 7-8, June-July 2009, pp. 625-632.

Ruel, M 2013. Fuzzy Logic Control On a SAG mill, 16th IFAC Symposium on Automation in Mining, Mineral and Metal
Processing, pp. 282-287.

Smith, G. C, Jordaan, L, Singh, A, Vandayar, V, Smith V.C, Muller B and Hulbert D.G 2004. Innovative process control
technology for milling and flotation circuit operations, The Journal of The South African Institute of Mining and
Metallurgy, Vol. May 2004, pp 353-366.

Toor, P 2015. Optimisation of a Semi-autogenous Grinding Mill through Trajectory and Power Modelling, MetPlant 2015.

Mining Metals refining