Metso Insights Blog Mining and metals blog Advanced grinding circuit control using online analyzer systems
Mining
Jun 16, 2017

Advanced grinding circuit control using online analyzer systems

Grinding circuit efficiency is pivotal to the performance of ore beneficiation. However, establishing stable operating conditions to maximize throughput, energy efficiency and ensure optimal particle size is a challenging task for any grinding circuit. Variable feed ore characteristics and circulating loads with sometimes complex circuits and varying operator skills between shifts are common sources of variance observed in the process.

Advanced Process Control (APC) systems have been one of the most beneficial tools in past decades in the minerals processing industry in decreasing process variance and enabling operation closer to process boundaries. However, it is important to understand that the performance of these systems is highly dependent on getting reliable real-time information from the process, which is needed for good control actions. 

In order to optimize grinding circuits, new analyzer systems for online 3D based particle size imaging and strain gauge based mill charge analysis have been developed. The introduction of these new systems has provided a more holistic view to the status and performance of the circuits and thus made it possible to implement more robust and beneficial APC strategies for stabilization and optimization.

Grinding circuit optimization with APC

Advanced process control (APC) and optimization systems have been one of the most beneficial tools in past decades in the minerals processing industry. APC has the capability to take into account multiple variables with time delays, interactions and constraints during multiple changes, typically to set-points of the regulatory level controllers. APC systems and applications run at the highest levels of control system hierarchy and typically utilize advanced calculations, delay compensators and estimators with rule and model based predictive and multivariable techniques. A well instrumented process, tuned base level controls, understanding of the process, mineralogy and constraints are absolute requirements for a successful implementation and benefits.

Typical APC objectives for a grinding circuit are:

  • Maximize grinding capacity while keeping the particle size within optimal range
  • Minimize disturbances and stabilize feed to downstream processing
  • Increase the availability of the grinding circuit and equipment
  • Optimize circulating loads
  • Minimize energy and consumable usage

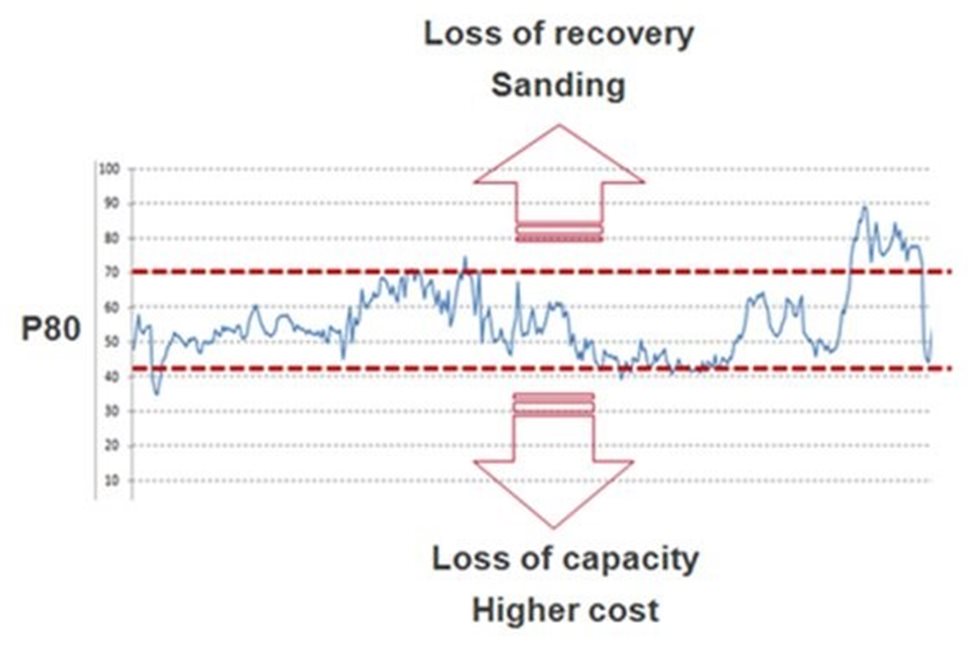
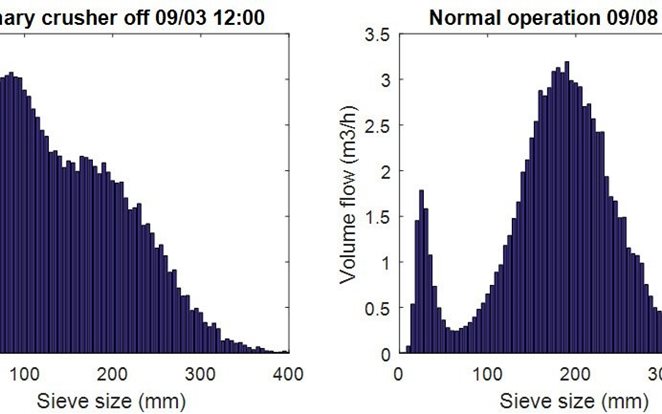
For many grinding APC strategies, particle size at the cyclone overflow is a critical feedback variable for determining the circuit's state and efficiency. For downstream processing, valuable minerals and metals recovery and the usage of the energy and reagents, are often highly dependent on the feed particle size distribution as shown in Figure 1.

Typical effects of too fine or coarse particle size (P80, µm)
Figure 1: Typical effects of too fine or coarse particle size (P80, µm)

Online particle-size analyzers using either direct mechanical or laser scattering technologies, such as shown in Figure 2 below, are commonly used in minerals processing applications due to the high reliability, representativity, precision and measurement speed requirements. Ultrasonic attenuation has also been applied in wet mineral processes since the 1970s. The sample volume measured can be relatively large, which is an advantage of this technology. The major limitations of ultrasonic particle size analysis in mineral processing operations are its sensitivity to entrained air bubbles, flaky particles, solids content variation and viscosity changes. These interferences necessitate frequent time and labor consuming calibrations.

online particle analyzers
Figure 2: Typical online particle analyzers measuring sampled process flow with direct mechanical measurement (left) and laser scattering (right) technology

Case study: Grinding circuits

The data presented in this study is obtained from the concentrators of three different mines.

The first mine is an open-pit mine located in Europe. The concentrator plant consists of crushing, milling and sequential flotation of copper and nickel concentrates with PGEs. The milling section has two parallel 7 MW AG mills combined with a 14 MW pebble mill. The mid-fraction of the primary crusher product is screened for secondary crushing and pebble mill media, and small and larger fractions are stored in a stockpile as a feed for the AG mills.

LKAB Kiruna is the world’s largest underground iron ore mine located in Northern Sweden. The milling section at the Kiruna KA3 concentrator plant consists of two primary AG mills combined with two secondary pebble mills.

On-belt particle analyzer results

The on-belt particle size analyzer has been in process usage at the concentrator since November 2014, and a second unit is to be installed in February 2016. The analyzer is used to monitor and control the particle size distribution of the primary AG mill fresh feed. Figure 3 demonstrates the automatic detection of the particles on the belt. A typical operation example is shown in Figure 3a, whereas Figure 3b illustrates the detection of an oversized particle (over 400 mm). A warning can be automatically issued for the oversized particles, so that the operators can take necessary actions to e.g. prevent blockages in the following process stages.

Segmentation results
Figure 3: Segmentation results: (a) typical size distribution; (b) detection of an oversized particle (408 mm)

For the AG mill, the optimal particle size distribution of the fresh feed contains enough large particles or lumps that work as the grinding medium. The particles with sieve size over 100 mm are treated as lumps and their relative amount in the total feed distribution is monitored by the on-belt analyzer which provides a real-time measurement of the particle size distribution on the belt.

Figure 4 visualizes the changes in the particle size distribution while the primary crusher at the plant was initially not operating, and then after a maintenance break when the crusher is back in operation. During the crusher shut-down there is a large amount of mid-fraction in the feed (Figure 4), whereas during the normal operation the feed contains mainly lumps, as intended. In Figures 4 and 5 the unclassified fines are excluded from the distributions.

{{zoomedImageIndex + 1}}/2
{{ captions[zoomedImageIndex] }}

The relative amount of lumps at the AG mill fresh feed is measured as the lump ratio, which is calculated as the number of detected lump particles on the belt per hour divided by the belt mass flow (t/h). In otherwise stable operating conditions, the lump ratio gives a good indication of the mill power as shown by Figure 6, where the mill power and lump ratio are compared for over one and half days. Consequently, the lump ratio is used at the plant to control the ratio of two feeders that feed either bigger or smaller rocks from a stockpile to the AG mill.

Lump ratio (#lumps/t) in the AG mill fresh feed
Figure 6: Lump ratio (#lumps/t) in the AG mill fresh feed measured by the on-belt particle size analyzer is a good predictor of the mill power in otherwise stable operating conditions

Mill charge analyzer results

Mill charge analyzers have been in operational use in several plants, including all case study mines. The analyzer has been installed in the secondary pebble mill since January 2015 and in the primary AG mill in Kiruna since March 2015.

The mill charge measurement provided by the mill charge analyzer is close to the traditional mill load value measured by the mill bearing pressure or mill weight. However, the charge value is directly indicating the mill charge volume instead of the weight of the mill and its contents. A long-term comparison of the mill charge measurement against the traditional bearing pressure is shown in Figure 7. Clearly, the bearing pressure starts to deviate from the mill charge after roughly a week of continuous operation.

Mill charge measurement
Figure 7: Mill charge provided by the mill charge analyzer gives a reliable long-term measurement of the volumetric charge of the mill, whereas the bearing pressure measures the weight of the whole mill and is affected e.g. by liner wearing and temperature changes

At Kiruna mill, the mill charge analyzer can be used to examine the operating point of the primary AG mill accordingly. In this example, the mill is operated well below the maximum power draw charge, resulting in a good correlation of the mill power and charge, as seen in Figures 8 and 9.

{{zoomedImageIndex + 1}}/2
{{ captions[zoomedImageIndex] }}

Discussion and conclusion

As demonstrated in the case studies, being able to measure accurately the mill feed particle size and the mill charge provides additional benefits for increasing the grinding circuit’s robustness towards alternating feed characteristics, and therefore the efficiency, availability and throughput of the mills. 

The developed on-belt particle size analyzer provides a reliable measurement of the ore particle size distribution on the belt. This information is readily available for monitoring and controlling the particle size of the grinding mill feed, which is especially important in the case of AG and SAG mills for ensuring stable and optimal milling operation. Information can also be beneficial in determining the performance and condition of the crushing and mining systems and procedures.

The online volumetric mill charge measurement, on the other hand, is crucial for maintaining the target mill charge level at all times regardless of the changes in the ore properties. As opposed to the mill weight based measurement approaches like bearing pressure, the strain gauge based analyzer presented in this study is able to accurately estimate the volumetric charge of the mill. The measurement result can be used to improve the mill availability, for instance, by preventing the overfilling events of the mill and to optimize the mill charge on the desired level for maximized throughput and energy efficiency.

On-belt particle size measurement at the grinding circuit feed, the mill volumetric charge estimation and the online slurry particle size analyzer measurements at the cyclone overflow with traditional instruments provide a holistic view to optimize grinding circuit with proven APC strategies. Commonly an APC control strategy is targeting to high throughput in grinding while keeping the product particle size distribution in a narrow size range for effective downstream processes. In addition to the proper control strategy design, the operator user interface is a key component for the high long-term availability. Unfortunately, usability and the operator´s ability to understand and affect the APC control parameters are easily forgotten and more emphasis is given for more complex control strategies instead. The more the operators trust the system, the higher utilization rates are witnessed. This often converts to decreased number of missed opportunities in process management because operators can focus more on overall efficiency (OEE) and unexpected events rather than single controls loops.

Acknowledgements

LKAB and other participating mining companies are greatly acknowledged for their co-operation and permitting the results, experiences and data to be presented.

Mining